 Cloud Ops Chronicles
The Quest for the Devops Grail: Reconciling Zero Scaling and Immediate Availability
In the ruthless world of the cloud, every unused resource represents an unnecessary cost. Zero scaling of Kubernetes pods, while attractive for optimizing costs, often results in a degraded user experience with unavailable applications. How then can you reconcile savings and responsiveness?
Forget about compromises, and adopt an event-driven approach, combining the power of Event Driven Ansible with the finesse of tools like Istio, Prometheus, and Alertmanager. Imagine a system capable of:
- Instantly detecting the first HTTP calls to your applications.
- Automatically triggering the launch of your Kubernetes pods to meet demand.
- Orchestrating the scaling of your resources dynamically and transparently.
- Reducing your infrastructure costs by stopping inactive pods.
No more waiting for your applications to restart, availability is almost immediate, and your users don’t notice a thing!
In this article, we will explore in detail how to implement this elegant and efficient solution. You will discover:
- The mechanisms of event detection based on HTTP traffic.
- The configuration of intelligent alerts to trigger autoscaling.
- The implementation of Ansible playbooks to automate the scaling of your deployments.
Get ready to say goodbye to compromises and enter the era of intelligent zero scaling!
Understanding the Problem
Consider a development or test environment. An “operator” could turn on the environment before using it and turn it off (zero scaling) afterwards. However, the DevOps approach aims to automate these processes to eliminate manual interventions.
The challenge lies in finding an automatic solution to manage scaling dynamically, adapting to fluctuations in demand. We want the environment to be immediately available when needed, without users experiencing any wait time.
The Solution: Event-Driven Autoscaling
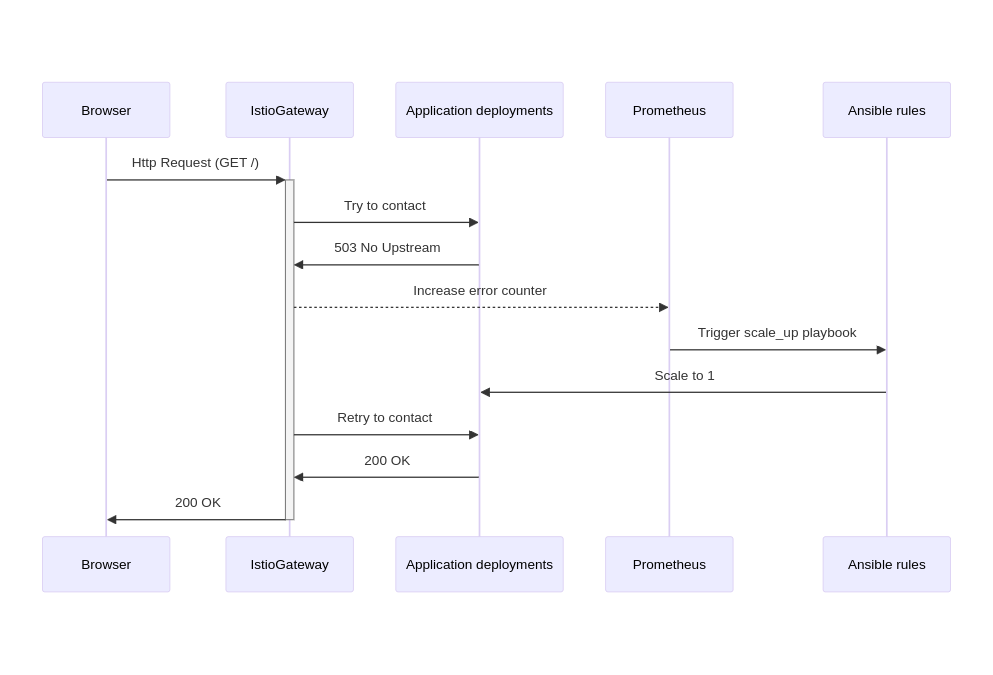
Event-based autoscaling is the key to reconciling resource savings and immediate availability. The idea is to monitor HTTP traffic to Kubernetes pods and automatically trigger scaling (increase the number of pods) when requests do not find destinations.
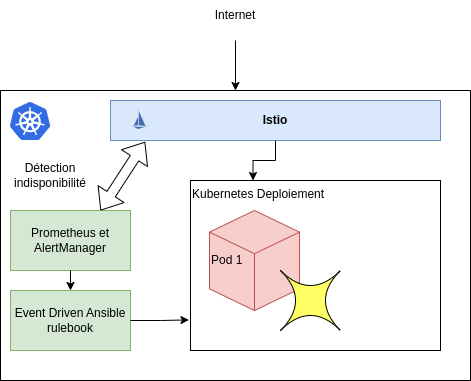
How the System Works
- Event Detection: Istio, a traffic management tool, monitors HTTP traffic to your Kubernetes pods.
- Data Collection: Prometheus, a monitoring system, collects traffic data from Istio.
- Alert Generation: Alertmanager analyzes Prometheus data and triggers alerts when HTTP traffic exceeds a defined threshold.
- Automatic Action: Alertmanager alerts trigger Ansible playbooks via Event Driven Ansible, which automatically launch Kubernetes pods.
- Automatic Shutdown: When there is no more HTTP traffic for a defined period, Alertmanager triggers another Ansible playbook that stops the pods.
Setting up the Platform
Installing kubernetes+istio
We will use Google Kubernetes Engine (GKE) with Node-Autoscaling, which automatically handles node scaling. This helps optimize billable resources based on the number of pods running.
gcloud compute networks create scaleto0-vpc --project $PROJECT_ID
gcloud container clusters create scaleto0-demo \
--enable-autoscaling \
--num-nodes 1 \
--min-nodes 1 \
--max-nodes 3 \
--network scaleto0-vpc \
--project $PROJECT_ID \
--release-channel=regular \
--zone=${REGION}-b
gcloud container clusters get-credentials scaleto0-demo \
--zone=${REGION}-b \
--project=$PROJECT_ID
Next, we will install Istio for traffic management:
curl -L https://istio.io/downloadIstio | sh -
cd istio-<<VERSION>>
./bin/istioctl install --set profile=demo -y
Verify the Istio installation:
# Check the status of pods
kubectl get pods -n istio-system

# Check the status of services and make sure an external LB is created for istio-ingressgateway
kubectl get svc -n istio-system
Installing monitoring: Prometheus / Alertmanager
In this article we will perform the installation of a minimalist monitoring system for Istio, focusing only on monitoring Istio itself, without monitoring servers, CPU or RAM. We will use a Helm chart for simplified installation and maintain consistency with the rest of the article by using the istio-system namespace.
helm upgrade -i -n istio-system prometheus prometheus-community/prometheus -f - << EOF
---
# prometheus_values.yaml
rbac:
create: true
configmapReload:
prometheus:
enabled: false
server:
namespaces:
- istio-system
resources:
limits:
cpu: 100m
memory: 512Mi
requests:
cpu: 100m
memory: 512Mi
global:
scrape_interval: 1s
scrape_timeout: 1s
evaluation_interval: 2s
serverFiles:
prometheus.yml:
rule_files:
- /etc/config/recording_rules.yml
- /etc/config/alerting_rules.yml
scrape_configs:
- job_name: 'istiod'
kubernetes_sd_configs:
- role: pod
relabel_configs:
- source_labels: [__meta_kubernetes_pod_annotation_prometheus_io_scrape]
action: keep
regex: true
- source_labels: [__meta_kubernetes_pod_annotation_prometheus_io_scrape_slow]
action: drop
regex: true
- source_labels: [__meta_kubernetes_pod_annotation_prometheus_io_scheme]
action: replace
regex: (https?)
target_label: __scheme__
- source_labels: [__meta_kubernetes_pod_annotation_prometheus_io_path]
action: replace
target_label: __metrics_path__
regex: (.+)
- source_labels: [__meta_kubernetes_pod_annotation_prometheus_io_port, __meta_kubernetes_pod_ip]
action: replace
regex: (\\d+);(([A-Fa-f0-9]{1,4}::?){1,7}[A-Fa-f0-9]{1,4})
replacement: '[\$2]:\$1'
target_label: __address__
- source_labels: [__meta_kubernetes_pod_annotation_prometheus_io_port, __meta_kubernetes_pod_ip]
action: replace
regex: (\\d+);((([0-9]+?)(\\.|$)){4})
replacement: \$2:\$1
target_label: __address__
- action: labelmap
regex: __meta_kubernetes_pod_annotation_prometheus_io_param_(.+)
replacement: __param_$1
- action: labelmap
regex: __meta_kubernetes_pod_label_(.+)
- source_labels: [__meta_kubernetes_namespace]
action: replace
target_label: namespace
- source_labels: [__meta_kubernetes_pod_name]
action: replace
target_label: pod
- source_labels: [__meta_kubernetes_pod_phase]
regex: Pending|Succeeded|Failed|Completed
action: drop
- source_labels: [__meta_kubernetes_pod_node_name]
action: replace
target_label: node
alertmanager:
enabled: true

kube-state-metrics:
enabled: false

prometheus-node-exporter:
enabled: false

prometheus-pushgateway:
enabled: false
EOF
kubectl create clusterrole prometheus-server --verb=get,list,watch --resource=pods,endpoints,services,nodes,namespaces
kubectl create clusterrolebinding prometheus-server --clusterrole=prometheus-server --serviceaccount=istio-system:prometheus-server
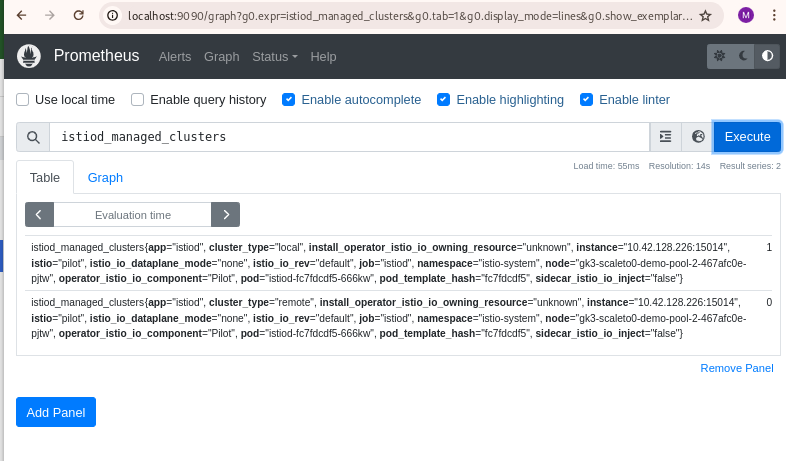
To test the monitoring system, we can use the following command to redirect http://localhost:9090 to the Prometheus pod:
kubectl --namespace istio-system port-forward $(kubectl get pods --namespace istio-system -l "app.kubernetes.io/name=prometheus,app.kubernetes.io/instance=prometheus" -o jsonpath="{.items[0].metadata.name}") 9090
Then open a web browser at the address: http://localhost:9090
Installing an Application
To simulate an application in our demo, we will use “whoami” which simply returns the HTTP request it receives. If it works with “whoami”, we can apply the same principle to all deployments on the Kubernetes cluster.
Let’s create a YAML file for the deployment, as follows:
This YAML code describes the configuration of a Kubernetes deployment for an application named “whoami”.
- Deployment “whoami”: Defines a deployment with the name “whoami” that uses the Docker image “traefik/whoami:latest”. It indicates that the deployment should have 1 “replica” (scaling to 1).
- Service “whoami”: Defines a Kubernetes service named “whoami” that connects to pods with the label “app: whoami”. Exposes port 80 of the service, which redirects to port 80 of the container.
kubectl create ns whoami
kubectl label namespace whoami istio-injection=enabled
kubectl apply -n whoami -f - <<EOF
# whoami_deployment.yaml
---
apiVersion: apps/v1
kind: Deployment
metadata:
name: whoami
annotations:
"sidecar.istio.io/proxyCPU": "500m"
"sidecar.istio.io/proxyMemory": "512Mi"
spec:
selector:
matchLabels:
app: whoami
replicas: 1
template:
metadata:
labels:
app: whoami
spec:
containers:
- name: master
image: traefik/whoami:latest
resources:
requests:
cpu: 500m
memory: 512Mi
limits:
cpu: 500m
memory: 512Mi
ports:
- containerPort: 80
---
apiVersion: v1
kind: Service
metadata:
name: whoami
labels:
app: whoami
spec:
ports:
- port: 80
targetPort: 80
selector:
app: whoami
EOF
And expose this service via Istio:
kubectl apply -n whoami -f - <<EOF
apiVersion: networking.istio.io/v1alpha3
kind: Gateway
metadata:
name: whoami-gateway
spec:
# The selector matches the ingress gateway pod labels.
# If you installed Istio using Helm following the standard documentation, this would be "istio=ingress"
selector:
istio: ingressgateway
servers:
- port:
number: 80
name: http
protocol: HTTP
hosts:
- "*"
---
apiVersion: networking.istio.io/v1alpha3
kind: VirtualService
metadata:
name: whoami
spec:
hosts:
- "*"
gateways:
- whoami-gateway
http:
- match:
- uri:
prefix: /
route:
- destination:
port:
number: 80
host: whoami
retries:
attempts: 15
perTryTimeout: 2s
EOF
Testing the application
INGRESS_HOST=$(kubectl get svc -n istio-system istio-ingressgateway -o jsonpath="{.status.loadBalancer.ingress[0].ip}" )
curl -s -I -HHost:whoami.scaleto0.demo "http://$INGRESS_HOST/"
HTTP/1.1 200 OK
date: Thu, 30 May 2024 20:21:32 GMT
content-length: 570
content-type: text/plain; charset=utf-8
x-envoy-upstream-service-time: 1073
server: istio-envoy
Downscaling the application
kubectl -n whoami scale deployment whoami --replicas=0
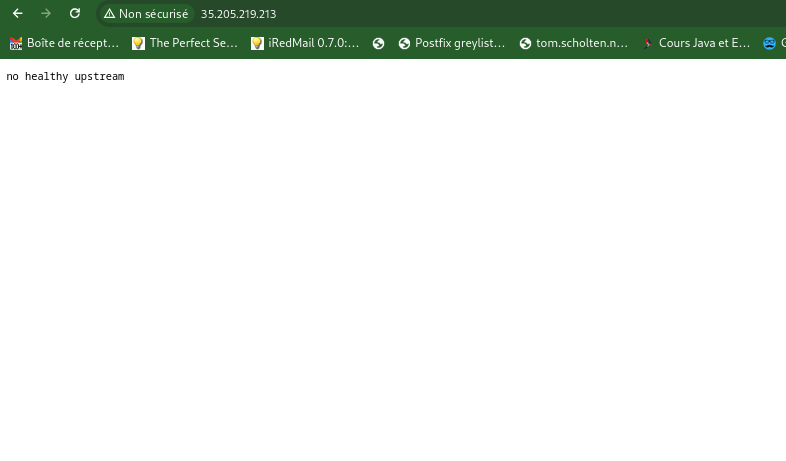
Once the application is cut off (down), it should no longer work: Application unavailability
curl -s -I -HHost:whoami.scaleto0.demo "http://$INGRESS_HOST:$INGRESS_PORT/"

HTTP/1.1 503 Service Unavailable
content-length: 19
content-type: text/plain
date: Thu, 30 May 2024 20:22:56 GMT
server: istio-envoy
Event Driven Ansible
Following Redhat documentation, we will build a container image to serve our rulebook. Here is the Dockerfile that creates a container to run the “ansible-rulebook” command.
cat > Dockerfile << EOF
FROM debian:latest

RUN apt-get update && \
apt-get --assume-yes install openjdk-17-jdk python3-pip python3-psycopg && \
pip3 install ansible ansible-rulebook ansible-runner kubernetes --break-system-packages

RUN mkdir /app && \
useradd -u 1001 -ms /bin/bash ansible && \
chown ansible:root /app

WORKDIR /app
USER ansible

RUN ansible-galaxy collection install ansible.eda

ENTRYPOINT ["ansible-rulebook", "-r", "/app/rules.yaml", "-i", "/app/inventory.yml", "-S", "/app"]
EOF
We can build and save our image in Google’s artifact-registry:
# Creating the repository
gcloud artifacts repositories create scaleto0-demo-repo --repository-format=docker \
--location=$REGION --description="Docker scaleto0 Demo repository"

# Creating the image
gcloud builds submit --region=$REGION --tag $REGION-docker.pkg.dev/$PROJECT_ID/scaleto0-demo-repo/rulebook-scaleto0-demo:v1
This container will be deployed in Kubernetes. We will overload the /app/rules.yaml file to include our rules and playbooks, including those for scaling.
Implementing EDA in the Cluster
Building a playbook for scaling
Ansible, a powerful language for manipulating infrastructure components, allows us to create a “playbook” that will allow us to scale the Kubernetes deployment.
cat > scale-deployment.yaml << EOF
---
- hosts: localhost
connection: local
gather_facts: false
tasks:
- name: Scale deployment up
kubernetes.core.k8s_scale:
api_version: v1
kind: Deployment
name: "{{ deployment_name }}"
namespace: "{{ namespace }}"
replicas: "{{ num_replicas }}"
wait_timeout: 60
EOF
We can test the playbook with the command below:
ansible-playbook -e '{"deployment_name":"whoami", "namespace":"whoami", "num_replicas": "1"}' scale-deployment.yaml
Next, let’s create a rules.yaml file to define the interface between monitoring and the scaling playbook.
cat > rules.yaml << EOF
- name: Scale deployment up
hosts: localhost
gather_facts: false
sources:
- name: webhook
ansible.eda.webhook:
port: 5000
rules:
- name: whoami
condition: true
actions:
- run_playbook:
name: scale-deployment.yaml
extra_vars:
deployment_name: whoami
namespace: whoami
num_replicas: 1
EOF
cat > inventory.yml << EOF
ungrouped:
hosts:
localhost:
ansible_connection: local
EOF
Injecting the playbook into Kubernetes:
kubectl create ns ansible-rulebook
kubectl create -n ansible-rulebook configmap ansible-rulebook-config --from-file=.
Starting the container:
kubectl -n ansible-rulebook apply -f - << EOF
# ansible-rulebook_deployment.yaml
---
apiVersion: apps/v1
kind: Deployment
metadata:
name: ansible-rulebook
spec:
selector:
matchLabels:
app: ansible-rulebook
replicas: 1
template:
metadata:
labels:
app: ansible-rulebook
spec:
containers:
- name: master
image: $REGION-docker.pkg.dev/$PROJECT_ID/scaleto0-demo-repo/rulebook-scaleto0-demo:v1
resources:
requests:
cpu: 100m
memory: 128Mi
limits:
cpu: 500m
memory: 512Mi
ports:
- containerPort: 5000
volumeMounts:
- name: config
mountPath: /app
volumes:
- name: config
configMap:
name: ansible-rulebook-config
---
apiVersion: v1
kind: Service
metadata:
name: ansible-rulebook
labels:
app: ansible-rulebook
spec:
ports:
- port: 5000
targetPort: 5000
selector:
app: ansible-rulebook
EOF
Granting rights to ansible-rulebook to interact with Kubernetes:
kubectl apply -f - << EOF
# ansible-rulebook_clusterrole.yaml
---
apiVersion: rbac.authorization.k8s.io/v1
kind: ClusterRole
metadata:
creationTimestamp: "2024-05-31T19:01:36Z"
name: deployment-scaler
rules:
- apiGroups:
- apps
resources:
- deployments/scale
- deployments
verbs:
- get
- list
- patch
- update
EOF
Finally, mapping the ansible-rulebook role to the deployment:
kubectl create clusterrolebinding deployment-scaler --clusterrole=deployment-scaler --serviceaccount=ansible-rulebook:default
Integration with Supervision
Alertmanager needs to be connected to Ansible rulebook. To do this, let’s update the Alertmanager configuration to have it send its alerts to the rulebook.
kubectl patch -n istio-system configmap prometheus-alertmanager --type merge -p "
data:
alertmanager.yml: |
global: {}
receivers:
- name: default-receiver
webhook_configs:
- url: http://ansible-rulebook.ansible-rulebook.svc.cluster.local:5000/endpoint
route:
group_interval: 5s
group_wait: 10s
receiver: default-receiver
repeat_interval: 5m
templates:
- /etc/alertmanager/*.tmpl
"
Restart the monitoring pods to take into account the new configmap:
kubectl -n istio-system rollout restart statefulset/prometheus-alertmanager
Creating the Supervision Alert
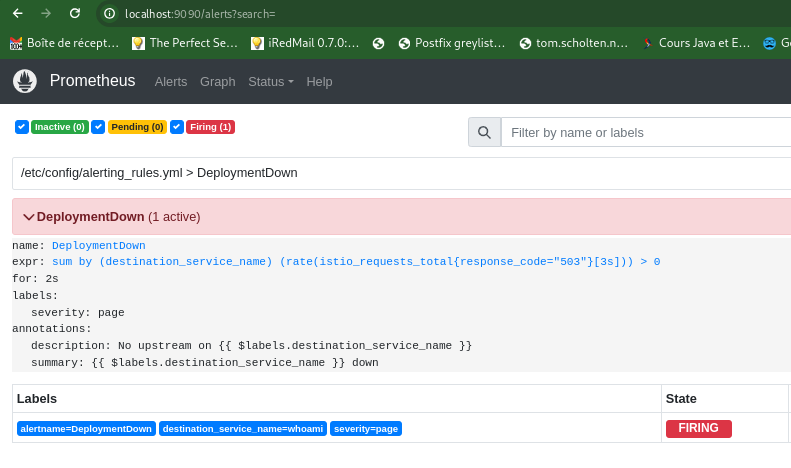
Let’s create a supervision alert that will detect 503 errors in Prometheus and trigger the Ansible “rulebook”.
Since Prometheus is installed with Helm, we will update the static configuration to inject the alert. In a production environment, alerts would be injected via the operator and “PrometheusRules” CRDs.
kubectl patch -n istio-system configmap prometheus-server --type merge -p "
data:
alerting_rules.yml: |
groups:
- name: DeploymentDown
rules:
- alert: DeploymentDown
expr: sum by (destination_service_name) (rate(istio_requests_total{response_code=\"503\"}[3s])) > 0
for: 2s
labels:
severity: page
annotations:
description: 'No upstream on {{ \$labels.destination_service_name }}'
summary: '{{ \$labels.destination_service_name }} down'
"
Restart the monitoring pods to take into account the new configmap:
kubectl -n istio-system rollout restart deployment/prometheus-server
After generating a few calls to the application without pods, we should find the alert in Prometheus:
Testing Zero Scaling
1. Basic test:
-
Scenario: Start the “whoami” application with a single pod and observe that the application is accessible.
-
Access the “whoami” service via a browser or curl: Verify that the result is correct and keep the window open to view the status of the application.
INGRESS_HOST=$(kubectl get svc -n istio-system istio-ingressgateway -o jsonpath="{.status.loadBalancer.ingress[0].ip}" )
watch curl -s -I -HHost:whoami.scaleto0.demo "http://$INGRESS_HOST/"
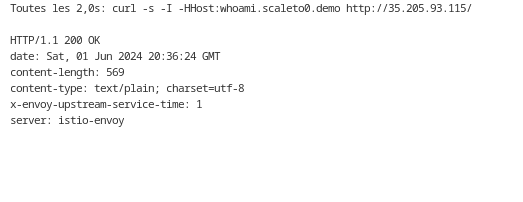 * Make sure you get an HTTP 200 response and that the content returned corresponds to the “whoami” application.
* Verify that the “whoami” pod is running in the Kubernetes cluster.
* Make sure you get an HTTP 200 response and that the content returned corresponds to the “whoami” application.
* Verify that the “whoami” pod is running in the Kubernetes cluster.
$ kubectl -n whoami get pod
NAME READY STATUS RESTARTS AGE
whoami-5d696b585d-twv98 2/2 Running 0 4m58s
2. Testing zero scaling:
- Scenario: Set the “whoami” application to zero pods and trigger HTTP requests to the application.
- Validation:
- Use the
kubectl -n whoami scale deployment whoami --replicas=0command to reduce the number of pods to zero. - Make several HTTP requests to the “whoami” application (via a browser or curl).
- Make sure the requests return an HTTP 503 (service unavailable) response.
- Verify that Prometheus monitoring detects the absence of a pod and generates an alert.
- Verify that the “DeploymentDown” alert is generated by Alertmanager and sent to the Ansible webhook.
- Verify that the Ansible playbook “scale-deployment.yaml” is executed and a new “whoami” pod is created
kubectl -n ansible-rulebook logs deployment/ansible-rulebook
From my side I observed that the service responds in 25 seconds after a cut-off.
Conclusion
Event-based autoscaling provides a perfect balance between resource optimization and the immediate availability of applications. By combining Event Driven Ansible with tools like Istio, Prometheus, and Alertmanager, you can implement a robust and efficient system to ensure optimal performance and reduced costs.
Key Benefits of This Approach
- Immediate availability: Pods are launched automatically on the first HTTP calls, ensuring a quick response to requests.
- Resource optimization: Pods are automatically shut down when they are no longer in use, reducing resource costs.
- Efficiency and reliability: The system works automatically and reliably, without human intervention.
- Scalability: The solution can be easily adapted to the evolving needs of applications.
Questions for Reflection
- Have you already implemented similar solutions for zero scaling in your Kubernetes environments?
- How can you adapt this solution to your specific needs and integrate it into your DevOps pipeline?
Additional Resources
- https://chimbu.medium.com/installing-istio-not-anthos-service-mesh-on-gke-autopilot-2b78f1bbe90a
- https://developers.redhat.com/articles/2024/04/12/event-driven-ansible-rulebook-automation#ansible_rulebook_cli_setup
- https://github.com/istio/istio/issues/10543#issuecomment-921179277
- https://medium.com/@letsretry/retry-between-region-using-ingress-controller-ingress-level-retry-e8c000580bfe